Matplotlib 簡介與常用技巧
Contents
5. Matplotlib 簡介與常用技巧
5.1. 通用技巧
5.1.1. Importing Matplotlib
標準的簡寫是
mpl和plt
import matplotlib as mpl
import matplotlib.pyplot as plt
5.1.2. Setting Styles
繪圖的風格,可以用
plt.style來設定,我們先用經典款 (classic) 的風格,就會很 matplotlib:
plt.style.use('classic')
5.1.3. show() or No show()?
有三個環境可以讓你用 matplotlib.
.py的 script 中.IPython的 terminal 中.Jupyter Notebook中。
5.1.3.1. 在 .py 文件中,要用 plt.show().
如果是在 script 中使用 matplotlib,就可以善用
plt.show()。執行 code 後,他會彈出視窗來顯示。舉例來說,我有一個
myplot.py這個 script 如下
# ------- file: myplot.py ------
import matplotlib.pyplot as plt
import numpy as np
x = np.linspace(0, 10, 100)
plt.plot(x, np.sin(x))
plt.plot(x, np.cos(x))
plt.show()
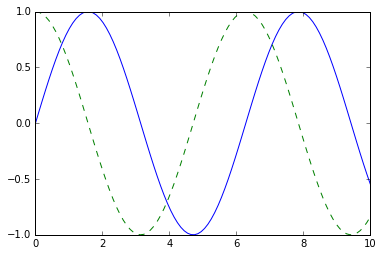
那我在 terminal 去 run 這個 script時,就會彈出視窗
$ python myplot.py
plt.show()在做的是,開啟一個事件迴圈,檢查目前活躍中的圖表物件,然後開啟一個交互式的視窗來顯示圖表要注意的是,
plt.show()在每個 python session 中,只會使用一次,通常都放在 script 的最末端。避免寫多個plt.show()
5.1.3.2. 在 IPython shell中,用 %matplotlib 就好,不用 plt.show()
在 Ipython shell 中,可以用
%matplotlib這個 magic command,例如以下:
In [1]: %matplotlib
Using matplotlib backend: TkAgg
In [2]: import matplotlib.pyplot as plt
之後就不需要再下
plt.show()了。你每次的繪圖,他都會開啟圖表視窗。
5.1.3.3. 在 Jupyter notbooke 中,用 %matplotlib inline 將靜態圖型嵌入
用
%matplotlib inline,可把靜態圖型嵌入,就不需要plt.show()了.用
%matplotlib notebook,可把互動式圖型嵌入,也不需要plt.show().直接來看例子:
         %matplotlib


         inline
import numpy as np
x = np.linspace(0, 10, 100)
fig = plt.figure()
plt.plot(x, np.sin(x), '-')
plt.plot(x, np.cos(x), '--');

5.1.4. Saving Figures to File
當我們用
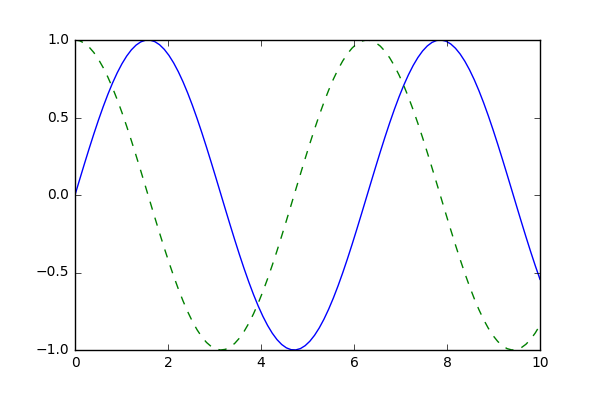
fig = plt.figure()去 initialize 一個 instance後,就可以用fig.savefig(),把圖片存成各種格式 (e.g.jpeg,jpg,png,pdf, …;)要注意的是,不需要再寫
plt.show()了
fig.savefig('figures/my_figure.png')
我們可以用
IPython.display裡面的Imagefunction,來讀取圖片檔,驗證看看我剛剛寫出來的圖片:
from IPython.display import Image
Image('figures/my_figure.png')

在 savefig() 中,靠副檔名來得知要存成啥格式。有許多不同檔案格式可以用,我們可透過 cavas 物件的 get_supported_filetypes() 這個 method,來看看支援哪些格式:
fig.canvas.get_supported_filetypes()
{'eps': 'Encapsulated Postscript',
 'jpg': 'Joint Photographic Experts Group',
 'jpeg': 'Joint Photographic Experts Group',
 'pdf': 'Portable Document Format',
 'pgf': 'PGF code for LaTeX',
 'png': 'Portable Network Graphics',
 'ps': 'Postscript',
 'raw': 'Raw RGBA bitmap',
 'rgba': 'Raw RGBA bitmap',
 'svg': 'Scalable Vector Graphics',
 'svgz': 'Scalable Vector Graphics',
 'tif': 'Tagged Image File Format',
 'tiff': 'Tagged Image File Format'}
5.2. Matplotlib 的雙介面
matplotlib的雙介面蠻容易讓人搞混的:
MATLAB-style state-based interface (就是我們最常看到的那種)
物件導向的 interface.
我們很快的來比較一下:
5.2.1. MATLAB-style Interface
Matplotlib原本是寫給 Python user 的一個 MATLAB 介面,所以語法都很像。
例如下面的例子,就超 MATLAB
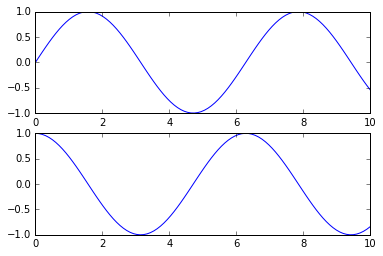
plt.figure()  # create a plot figure

# create the first of two panels and set current axis
plt.subplot(2, 1, 1) # (rows, columns, panel number)
plt.plot(x, np.sin(x))

# create the second panel and set current axis
plt.subplot(2, 1, 2)
plt.plot(x, np.cos(x));

print(plt.gcf())
print(plt.gca())
Figure(432x288)
AxesSubplot(0.125,0.125;0.775x0.352273)

這邊要注意的是,這個 interface 是
stateful: 他會 keeps track of the “current” figure and axes。例如,你可以用
plt.gcf()去 get current figure; 用plt.gca()去 get current axes儘管這種 stateful interface 拿來畫簡單的圖形時,又快又方便,但也很容易遇到問題。
例如,當你畫好 second panel 後,你要怎麼去改 first panel?
事實上是可以改,只是很難改。所以,就有另一種 interface 的出現 -> OOP 的介面
5.2.2. Object-oriented interface
物件導向的介面,可以讓你畫出更複雜的圖,也讓你對圖表又更多的控制
舉例如下:
# First create a grid of plots
# ax 是一個 array,裡面放 2 個 axis objects
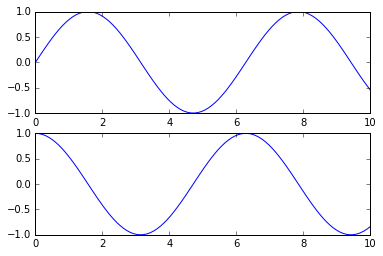
fig, ax = plt.subplots(2)

# 在適當的物件上,呼叫 plot() method
ax[0].plot(x, np.sin(x))
ax[1].plot(x, np.cos(x));

從 syntax 來看,可以發現,用
plt.subplots()後,就得到 fig 和 ax 兩個物件。後續就是用這些物件的 method 來畫至於要用哪一種介面,就看問題的情況。之後會有很多例子來練習。從 code 的角度來看,也僅僅是
plt.plot()或是ax.plot()的差別而已。
