Simple Line Plots
Contents
6. Simple Line Plots
這章要來講怎麼畫出 \(y = f(x)\) 圖形
首先來做些畫圖前的設定 (這邊用
seaborn-whitegrid的 style)
%matplotlib inline
import matplotlib.pyplot as plt
plt.style.use('seaborn-whitegrid')
import numpy as np
對於所有的 matplotlib plots,都是先建立
figure和axis我們可以建立最簡單的 figure 和 axis 如下
fig = plt.figure()
ax = plt.axes()
在 Matplotlib中,
figure是 an instance of the classplt.Figure,我們可以把 figure 想成一個容器,裡面包含 axes, graphics, text, labels…axes是 an instance of the classplt.Axes,也就是我們看到的,具有刻度(ticks)和標籤(label)的bounding box。最終,axes會包含我們畫上去的元素,組出我們要看到的視覺內容。(所以,我覺得 axes 根本就是一張圖的意思啊…)(axes是axis的複數,所以隱含多個軸的意思)一旦我們建立了一個 axes,我們就可以用
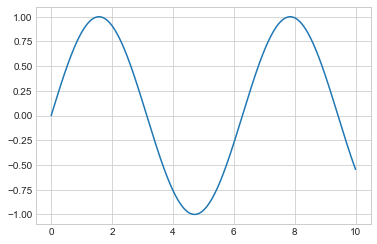
axes.plot()來畫圖。例如,來畫 sin 的圖形吧:
fig = plt.figure()
ax = plt.axes()

x = np.linspace(0, 10, 1000)
ax.plot(x, np.sin(x));
此外,我們也可以用
pylab介面,讓 figure 和 axes 在背景中建立:
plt.plot(x, np.sin(x));
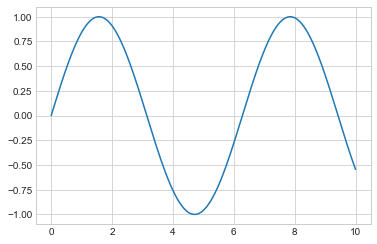
這邊注意一下,其實他在畫圖時,不是真的畫那個函數 (\(y = sin(x)\))
而是先生出 x 的點,再生出 y 的點,然後把這些 pair 點上去後,再用 line 連起來.
(之後學 scatter plot 後,就會發現,
plt.plot(x, y, "o")就是畫出 scatter plot,而這邊的plt.plot(x, y)會畫出線圖,是因為預設是plt.plot(x, y, "-"),而 “-” 就是 line plot 的意思)所以,圖型的平滑程度,取決於 x 有多少個點,這邊就生了 1000 個點,來讓圖型平滑.
如果要畫多個線條,就 call 多個
plt.plot()就好
plt.plot(x, np.sin(x))
plt.plot(x, np.cos(x));
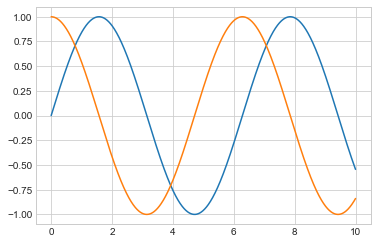
這大概就是 simple plot 該會的東西了.
接下來要開始講 axes 和 lines 的一些細節
6.1. 調整線條的 color 和 linestyle
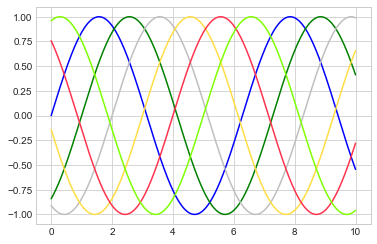
調整 color 的部分,有以下這些方法:
plt.plot(x, np.sin(x - 0), color='blue')        # 用 color name
plt.plot(x, np.sin(x - 1), color='g')           # 用 short color code (rgbcmyk)
plt.plot(x, np.sin(x - 2), color='0.75')        # 0 ~ 1 之間的灰階
plt.plot(x, np.sin(x - 3), color='#FFDD44')     # 16 進位的 Hex code (RRGGBB from 00 to FF)
plt.plot(x, np.sin(x - 4), color=(1.0,0.2,0.3)) # RGB tuple, values 0 to 1
plt.plot(x, np.sin(x - 5), color='chartreuse'); # all HTML color names supported
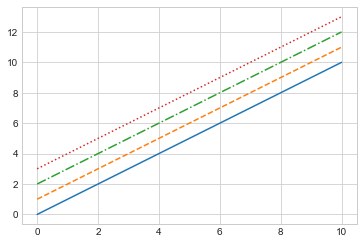
調整 linestyle 的部分,有以下這些方法:
plt.plot(x, x + 0, linestyle='solid')
plt.plot(x, x + 1, linestyle='dashed')
plt.plot(x, x + 2, linestyle='dashdot')
plt.plot(x, x + 3, linestyle='dotted');
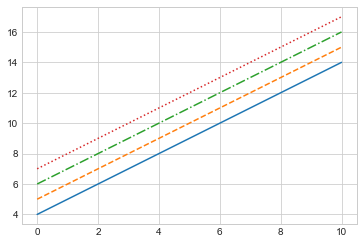
# 也可以用這種簡單的表示方式:
plt.plot(x, x + 4, linestyle='-')  # solid
plt.plot(x, x + 5, linestyle='--') # dashed
plt.plot(x, x + 6, linestyle='-.') # dashdot
plt.plot(x, x + 7, linestyle=':');  # dotted
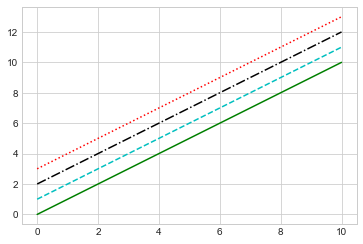
If you would like to be extremely terse, these linestyle and color codes can be combined into a single non-keyword argument to the plt.plot() function:
plt.plot(x, x + 0, '-g')  # solid green
plt.plot(x, x + 1, '--c') # dashed cyan
plt.plot(x, x + 2, '-.k') # dashdot black
plt.plot(x, x + 3, ':r');  # dotted red
6.2. 調整 Axes Limits
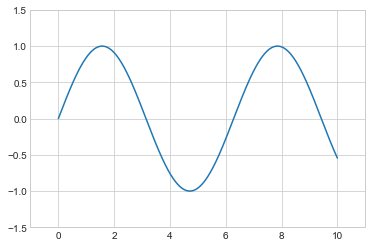
可以用
plt.xlim()andplt.ylim()methods:
plt.plot(x, np.sin(x))

plt.xlim(-1, 11)
plt.ylim(-1.5, 1.5);
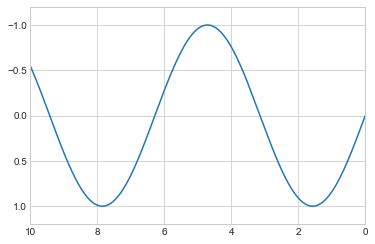
如果要把軸反轉(基於不知道啥的原因),就把參數由大寫到小就好:
plt.plot(x, np.sin(x))

plt.xlim(10, 0)
plt.ylim(1.2, -1.2);
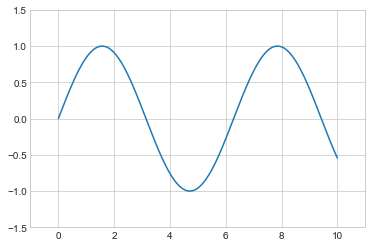
因為 axes 是 axis 的複數,所以也可以用
plt.axes([xmin, xmax, ymin, ymax])的方式來設定兩個軸的 range
plt.plot(x, np.sin(x))
plt.axis([-1, 11, -1.5, 1.5]);
plt.axis()(小心,是 axis,不是axes) 有一些高階參數,例如,讓圖形緊密(tight)一點:
plt.plot(x, np.sin(x))
plt.axis('tight');
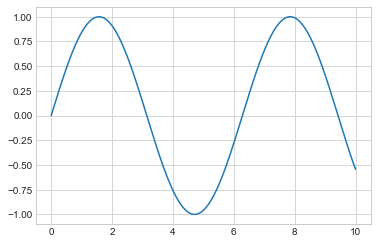
我們可以讓 x 和 y 的刻度一樣:
plt.plot(x, np.sin(x))
plt.axis('equal');
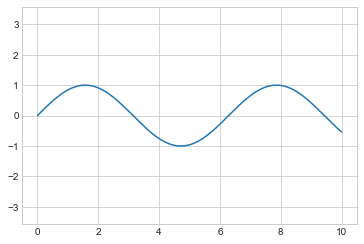
別忘了,可以用
plt.axis?來查詢更細節的用法
plt.axis?
Signature: plt.axis(*args, emit=True, **kwargs)
Docstring:
Convenience method to get or set some axis properties.

Call signatures::

  xmin, xmax, ymin, ymax = axis()
  xmin, xmax, ymin, ymax = axis([xmin, xmax, ymin, ymax])
  xmin, xmax, ymin, ymax = axis(option)
  xmin, xmax, ymin, ymax = axis(**kwargs)

Parameters
----------
xmin, xmax, ymin, ymax : float, optional
    The axis limits to be set.  This can also be achieved using ::

        ax.set(xlim=(xmin, xmax), ylim=(ymin, ymax))

option : bool or str
    If a bool, turns axis lines and labels on or off. If a string,
    possible values are:

    ======== ==========================================================
    Value    Description
    ======== ==========================================================
    'on'     Turn on axis lines and labels. Same as ``True``.
    'off'    Turn off axis lines and labels. Same as ``False``.
    'equal'  Set equal scaling (i.e., make circles circular) by
             changing axis limits. This is the same as
             ``ax.set_aspect('equal', adjustable='datalim')``.
             Explicit data limits may not be respected in this case.
    'scaled' Set equal scaling (i.e., make circles circular) by
             changing dimensions of the plot box. This is the same as
             ``ax.set_aspect('equal', adjustable='box', anchor='C')``.
             Additionally, further autoscaling will be disabled.
    'tight'  Set limits just large enough to show all data, then
             disable further autoscaling.
    'auto'   Automatic scaling (fill plot box with data).
    'image'  'scaled' with axis limits equal to data limits.
    'square' Square plot; similar to 'scaled', but initially forcing
             ``xmax-xmin == ymax-ymin``.
    ======== ==========================================================

emit : bool, default: True
    Whether observers are notified of the axis limit change.
    This option is passed on to `~.Axes.set_xlim` and
    `~.Axes.set_ylim`.

Returns
-------
xmin, xmax, ymin, ymax : float
    The axis limits.

See Also
--------
matplotlib.axes.Axes.set_xlim
matplotlib.axes.Axes.set_ylim
File:      /Volumes/GoogleDrive/我的雲端硬碟/0. codepool_python/python_ds/python_ds_env/lib/python3.8/site-packages/matplotlib/pyplot.py
Type:      function
6.3. Labeling Plots
label 就包含:
xlabel,ylabel,title, 以及 legend 要用的 label.來看範例:
plt.plot(x, np.sin(x))
plt.title("A Sine Curve")
plt.xlabel("x")
plt.ylabel("sin(x)");
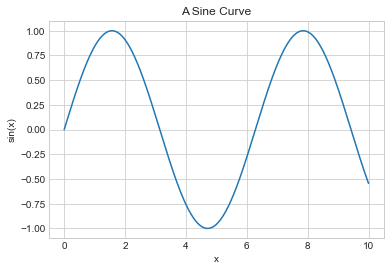
要畫 legend 的話,簡單的做法,是在每張圖上先幫他加上 label,最後再用
plt.legend(),他就會幫你做出來:
plt.plot(x, np.sin(x), '-g', label='sin(x)')
plt.plot(x, np.cos(x), ':b', label='cos(x)')
plt.axis('equal')

plt.legend();
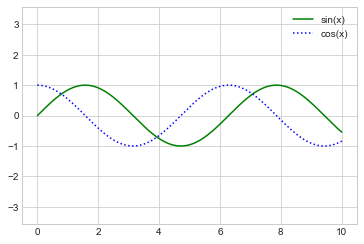
6.4. Matplotlib的陷阱
儘管大部分的
pltfunctions 都可轉成ax的 methods (例如plt.plot()→ax.plot(),plt.legend()→ax.legend(), etc.), 但不是全部的 plt function 都可以這樣轉成 ax 的 method.尤其是這章教的 limits, labels, and titles 名稱就有些微不同.
plt.xlabel()→ax.set_xlabel()plt.ylabel()→ax.set_ylabel()plt.xlim()→ax.set_xlim()plt.ylim()→ax.set_ylim()plt.title()→ax.set_title()
但其實用 oop 介面來畫圖時,很少直接 call 上面那些 methods,而是直接用
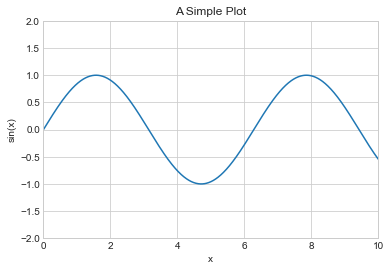
ax.set()把該設定的 properties 一次設定完:
ax = plt.axes()
ax.plot(x, np.sin(x))
ax.set(
    xlim=(0, 10),
    ylim=(-2, 2),
    xlabel='x',
    ylabel='sin(x)',
    title='A Simple Plot'
);
