Gaussian Mixture Model (GMM)
Contents
16. Gaussian Mixture Model (GMM)
%matplotlib inline
import matplotlib.pyplot as plt
import seaborn as sns; sns.set()  # for plot styling
import numpy as np
import pandas as pd

# from sklearn.datasets.samples_generator import make_blobs # 舊版寫法,已不能使用
from sklearn.datasets import make_blobs

from sklearn.cluster import KMeans
# from sklearn.mixture import GMM
from sklearn.mixture import GaussianMixture

from sklearn.preprocessing import StandardScaler

from sklearn.decomposition import PCA
from scipy.spatial.distance import cdist

def plot_kmeans(kmeans, X, n_clusters=4, rseed=0, ax=None):
    labels = kmeans.fit_predict(X)

    # plot the input data
    ax = ax or plt.gca()
    ax.axis('equal')
    ax.scatter(X[:, 0], X[:, 1], c=labels, s=20, cmap='viridis', alpha = 0.5, zorder=2)

    # plot the representation of the KMeans model
    centers = kmeans.cluster_centers_
    radii = [cdist(X[labels == i], [center]).max()
             for i, center in enumerate(centers)]
    for c, r in zip(centers, radii):
        ax.add_patch(plt.Circle(c, r, fc='#CCCCCC', lw=3, alpha=0.8, zorder=1))
from matplotlib.patches import Ellipse

def draw_ellipse(position, covariance, ax=None, **kwargs):
    """Draw an ellipse with a given position and covariance"""
    ax = ax or plt.gca()

    # Convert covariance to principal axes
    if covariance.shape == (2, 2):
        U, s, Vt = np.linalg.svd(covariance)
        angle = np.degrees(np.arctan2(U[1, 0], U[0, 0]))
        width, height = 2 * np.sqrt(s)
    else:
        angle = 0
        width, height = 2 * np.sqrt(covariance)

    # Draw the Ellipse
    for nsig in range(1, 4):
        ax.add_patch(Ellipse(position, nsig * width, nsig * height,
                             angle, **kwargs))

def plot_gmm(gmm, X, covariance_type="full", label=True, ax=None):
    ax = ax or plt.gca()
    labels = gmm.fit(X).predict(X)
    if label:
        ax.scatter(X[:, 0], X[:, 1], c=labels, s=40, cmap='viridis', zorder=2)
    else:
        ax.scatter(X[:, 0], X[:, 1], s=40, zorder=2)
    ax.axis('equal')

    centers = gmm.means_

    ax.scatter(centers[:, 0], centers[:, 1], c='red', s=100, alpha=0.5, zorder = 3);

    w_factor = 0.2 / gmm.weights_.max()

    if covariance_type == "spherical":
        cov_right_shape = np.array([np.identity(2) * eta for eta in gmm.covariances_])
    elif covariance_type == "diag":
        cov_right_shape = np.array([np.diagflat(eta) for eta in gmm.covariances_])
    elif covariance_type == "tied":
        cov_right_shape = np.array([gmm.covariances_ for i in range(gmm.n_components)])
    else:
        cov_right_shape = gmm.covariances_

    for pos, covar, w in zip(centers, cov_right_shape, gmm.weights_):
        draw_ellipse(pos, covar, alpha=w * w_factor)
16.1. Toy Example (多維, 多群)
16.1.1. 產生資料並先試試 KMeans
X, y_true = make_blobs(n_samples=400, centers=4,
                       cluster_std=0.60, random_state=0)
X = X[:, ::-1] # flip axes for better plotting

rng = np.random.RandomState(13)
X_stretched = np.dot(X, rng.randn(2, 2))

# 看資料的維度
print(X_stretched.shape)
# 看資料的前五筆
print(X_stretched[:5])
(400, 2)
[[-4.63330948  5.00361975]
 [-1.67654295  0.68197545]
 [-2.05710285  1.00284771]
 [-3.10473256  3.56955705]
 [-1.58585158  0.65172436]]
可以看到這是筆 400x2 的 data,feature 只有 2 維
畫個圖先看一下資料分布
ax = plt.gca()
ax.axis('equal')
ax.scatter(X_stretched[:, 0], X_stretched[:, 1], s=40, cmap='viridis');
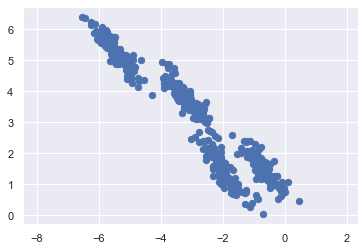
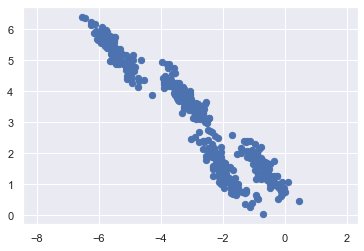
可以發現,資料分布看起來是 4 群
但有別於之前看過的例子,現在每一群的分配,比較像斜橢圓,而不是正圓.
那如果繼續用 KMeans 來分群,結果會如何呢?
kmeans = KMeans(n_clusters=4, random_state=0)
plot_kmeans(kmeans, X_stretched)
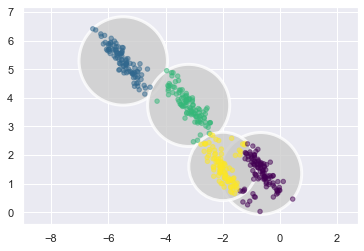
可以發現,第三群 和 第四群分的並不好。
這是因為,這兩群的圓出現了 overlap。所以交集的點,有些被分到左邊,有些被分到右邊。
這可以理解,因為每一群的點,看起來不是正圓,和 KMeans 的假設不合。
那我們試試有沒有辦法對資料做前處理,想辦法先讓他變正圓,再來做 KMeans.
先各個 feature 做 Normalization. (先讓 x,y 方向散的一樣開,此時會是 scale 相同的橢圓)
再做 PCA (把橢圓躺下來,變正圓)
col_normalizer = StandardScaler()
X_stretch_norm = col_normalizer.fit_transform(X_stretched)
print("column means: ", X_stretch_norm.mean(axis = 0))
print("column sd: ", X_stretch_norm.std(axis = 0))
print("cor of two feature: ")
print(np.corrcoef(X_stretch_norm[:,0], X_stretch_norm[:,1]))

kmeans = KMeans(n_clusters=4, random_state=0)
plot_kmeans(kmeans, X_stretch_norm)
column means:  [7.20534743e-16 1.94289029e-16]
column sd:  [1. 1.]
cor of two feature:
[[ 1.         -0.94271845]
 [-0.94271845  1.        ]]
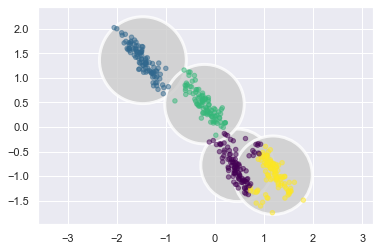
可以發現,效果沒變。還是分不好.
甚至,看最左上角那群,他在 y 方向散的比較開, x 方向散的比較窄。
理論上,做完標準化後,應該在兩個方向要散的一樣開,但為啥會這樣?
那是因為,我們是對
整個資料集做標準化,不是對個別的群做標準化。所以可以看到,對整個資料集來說,做完前處理後,兩個 feature 的平均數都是 0 ,標準差都是 1,兩個 feature 的相關性是 -0.94.
這也反映在整張圖的點,x 和 y 方向散的一樣開,正中心在 (0,0)
但這無濟於事,因為我是希望群內做標準化,才能讓他散的一樣開。but,你就還沒分群,當然無法做群內標準化。這流於雞生蛋,蛋生雞。
接下來,繼續做 PCA 看看
pca = PCA(n_components = 2)
X_stretch_norm_pca = pca.fit_transform(X_stretch_norm)

kmeans = KMeans(n_clusters=4, random_state=0)
plot_kmeans(kmeans, X_stretch_norm_pca)
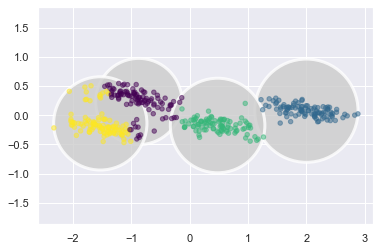
可以發現,橢圓都躺下來了,但還是無法解決 overlap 的問題.
理由同上,如果我們可以對各個群,自己做 Normalization + PCA,就能解決,但…我現在就是不知道各自屬於哪一群。
16.1.2. 從 KMeans 改到 GMM 的動機
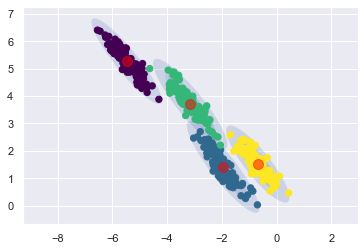
從上面的範例,大概可以了解 KMeans 的致命缺點了:
每一群的資料,必須分佈成正圓,才能分得好。(對於不是正圓的資料,做前處理也未必能轉換成正圓,最終無解。)
對於 overlap 的點,我們只能強硬的幫他分到某一類,我沒辦法指出,這些 overlap 的點,有多少機率來自第一群/第二群/…/第k群
而 GMM,作為 KMeans 的延伸,就是可以來解決以上兩點:
每一群的資料,是正圓或橢圓都沒關係。
每一個點,我都可以給出,他屬於 K 個群的各自可能性
16.1.3. 概念講解
之後整理,我覺得重點是以下幾個:
16.1.3.1. 資料生成模型
每一個資料點,都假設來自以下的 mixture of Gaussian distribution:
\(X_i \ \ iid \ \ \sim p_1*N(\mu_1, \Sigma_1)+p_2*N(\mu_2, \Sigma_2)+...+ p_K*N(\mu_K, \Sigma_K)\)
這個分佈,可以用各種角度來想 (先假設資料只有 1 維就好,那就是多峰的 Normal):
以 density 的形狀來說,他就像各種 normal訊號 的線性組合結果,\(p_k\) 就是權重.
以蒐集到 100 筆的資料後來想,就表示第k群的資料量,佔全部資料的 \(p_k\) 比例
以生成一筆新資料來說,就是有 \(p_k\) 比利的可能性,會從 第k群 的 normal 來生出一筆資料.
我覺得,用資料生成的圖,更好理解這個過程。假設我們現在想生成一筆 data,過程如下:
先從 \(S_i \sim Categorical(p_1, p_2, ..., p_k)\) 的分佈中,生成 \(S_i = k\),k=1,2,…,K,就可以知道這筆資料來自哪一組.
再從 \((X_i|S_i = k) \sim N(\mu_k, \Sigma_k)\) 的分佈中,生成 \(X_i = x_i\)
那我們現在要做參數估計時,就是上面的倒過來:
已經收到 \(x_i, i = 1,2, ..., N\) 的資料.
哪一組參數,最可能產出我手上收到的這筆資料?
16.1.3.2. 參數估計
要估計的參數,包括:
mixture 的權重: \(K-1\) 個 (因為只要知道 K-1 個權重,最後一個用 1 - 大家就好)
K 個 \(mu\) vector: \(K \times p\) 個.
K 個 \(\Sigma\) matrix: \(K \times \frac{p \times (p+1)}{2}\)
總計: \(\frac{1}{2} \times K \times (P+1) \times (P+2) - 1\)
令 \(\Theta = (p_1,...,p_K,\mu_1,\Sigma_1,...,\mu_K, \Sigma_K)\),則每一資料,生成的 pdf 如下:
收到 N 筆資料, join pdf (i.e. likelihood) 如下:
經過一番參數估計後(會用 EM 演算法,詳情參考之前統算推導),就可以得到
一組參數估計值: \(\hat{\Theta} = arg \ max L(\Theta|X)\)
一個 max likelihood 的值: \(L_{max} = L(\hat{\Theta}|X)\)
以及估計的參數個數
16.1.3.2.1. 選 \(\Sigma\) 限制式
剛剛在做參數估計時,對 \(\Sigma\),是沒有限制式的。
但其實沒有限制式的話,很可能造成要估計的參數過多(大過sample數),而造成無法估計。
所以,會做以下的限制
\(\Sigma_k\) |
限制式意義 |
|
參數個數 |
備註 |
|---|---|---|---|---|
\(\eta I\) |
每一群都是相同的正圓 |
a |
K(p+1) |
|
\(\eta_k \ I\) |
每一群是不同的正圓 |
|
K(p+2) -1 |
KMeans 在這 |
\(\eta_k\) Diag (\(\lambda_1\),…,\(\lambda_p\)) |
每一群是不同的正橢圓 |
|
K(p+2) + p -1 |
|
\(\Sigma\) |
每一群都是同一個斜橢圓 |
|
K-1 + K(px(p+1)/2) |
|
\(\Sigma_k\) (無限制) |
每一群是不同的斜橢圓 |
|
\(\frac{1}{2}\)K(p+1)(p+2) - 1 |
16.1.3.2.2. 選 k 
給定一個 k 後,就可以做上面的參數估計,估計完後,就可以得到 max liklihood 的值
可以想像, k 如果給越大, likelihood 會越好,但就越容易 overfitting.
所以,可以用
AICorBIC這兩個指標,來幫我們選模\(AIC = -2 \ ln \ L_{max} + 2 \times\) (number of parameters estimated) -> \(\hat{k} = arg \ min AIC\)
\(BIC = -2 \ ln \ L_{max} + ln(N) \times\) (number of parameters estimated) -> \(\hat{k} = arg \ min BIC\)
16.1.3.3. 預測(分群)
再來,就可以預估手上這筆 data,來自各群的可能性了,怎做? -> 用 posterior distribution 來處理:
經由上式,就得到 第i組 data,他在第 k 群的可能性。那跑遍 K 群,就得到他在每一群的預測值: \((\hat{\theta}_1^{(i)},\hat{\theta}_2^{(i)},...,\hat{\theta}_K^{(i)})\)
接下來,有兩種方式可以給出 硬分群 的結果.
從 \(Multinominal(n=1, \hat{\theta}_1^{(i)},\hat{\theta}_2^{(i)},...,\hat{\theta}_K^{(i)})\) 中,抽出一筆,可能值就是 1 or 2 or ,,, or K,那這就是預測群組了.
直接找最大的就好: \(\hat{k} = arg max \{ \hat{\theta}_1^{(i)},\hat{\theta}_2^{(i)},...,\hat{\theta}_K^{(i)} \}\)
16.1.4. code 實作
16.1.4.1. 資料
再來看一下剛剛的範例資料:
ax = plt.gca()
ax.axis('equal')
ax.scatter(X_stretched[:, 0], X_stretched[:, 1], s=40, cmap='viridis');
X_stretched.shape
(400, 2)
16.1.4.2. training
gm = GaussianMixture(n_components=4, n_init=10)
gm.fit(X_stretched);
看一下參數估計是否收斂:
print("是否收斂? ", gm.converged_)
print("EM iteration了幾次", gm.n_iter_)
是否收斂?  True
EM iteration了幾次 6
看一下參數估計的結果:
print("p hat: ", gm.weights_)
print("mu hat: ")
print(gm.means_)
print("Sigma hat: ")
print(gm.covariances_)
p hat:  [0.24960937 0.24856308 0.24726764 0.25455991]
mu hat:
[[-0.68373205  1.51591598]
 [-5.4736886   5.27447425]
 [-1.95405049  1.40907606]
 [-3.15090783  3.71109673]]
Sigma hat:
[[[ 0.15012765 -0.15798472]
  [-0.15798472  0.22221707]]

 [[ 0.18632125 -0.20655164]
  [-0.20655164  0.27558183]]

 [[ 0.19777594 -0.22402528]
  [-0.22402528  0.31418505]]

 [[ 0.20718288 -0.22448647]
  [-0.22448647  0.30342679]]]
看起來美賣:
分成 4 群,每一群的比例都差不多是 0.25。這和我從圖上看到的比例很像。
mu_hat 給我 4 組 mean vector,這等等畫圖再來看估得好不好.
Sigma hat 給我 4 個 covariance matrix,而且看起來都沒被限制 (因為 default 是
covariance_type = 'full'),可以想像等等會畫出 4 個不同的斜橢圓.
16.1.4.3. prediction(分群)
我們可以先做 軟分群:
gm_pred_prob = gm.predict_proba(X_stretched)
gm_pred_prob
array([[1.57650321e-22, 4.25123071e-01, 2.55374096e-07, 5.74876674e-01],
       [4.53546582e-15, 1.90957124e-17, 9.99999999e-01, 1.06652119e-09],
       [2.92853046e-17, 2.34378258e-14, 9.99999998e-01, 2.37101929e-09],
       ...,
       [9.99999920e-01, 1.08972061e-36, 2.05299504e-08, 5.89991829e-08],
       [3.68290892e-04, 2.08418557e-15, 4.45517666e-01, 5.54114043e-01],
       [1.00000000e+00, 3.80709722e-47, 5.71567299e-14, 1.76093911e-11]])
可以看到,第一個 sample,他在 k 個群上的預測機率。
我們可以找出最大值在哪:
np.argmax(gm_pred_prob[0])
3
可以得知,他是 index = 3 這一群
如果要做 硬分群,就這樣做就好:
#gm_pred = gm.predict(X_stretched)
gm_pred = np.argmax(gm_pred_prob, axis = -1)
gm_pred
array([3, 2, 2, 3, 2, 1, 0, 3, 2, 0, 1, 0, 3, 2, 2, 0, 2, 0, 3, 2, 2, 2,
       1, 3, 3, 1, 1, 3, 3, 0, 3, 3, 2, 3, 2, 1, 0, 3, 0, 3, 2, 1, 0, 3,
       0, 1, 0, 0, 0, 1, 1, 1, 2, 1, 1, 2, 3, 0, 0, 2, 0, 0, 0, 0, 3, 2,
       0, 3, 2, 1, 2, 3, 2, 1, 0, 2, 3, 2, 1, 2, 2, 3, 0, 1, 3, 2, 2, 3,
       2, 0, 2, 0, 3, 2, 2, 1, 3, 0, 0, 0, 1, 0, 3, 3, 2, 1, 3, 1, 0, 2,
       2, 2, 3, 2, 1, 0, 1, 2, 1, 1, 0, 2, 0, 1, 3, 1, 0, 0, 0, 3, 1, 1,
       1, 2, 3, 2, 1, 3, 1, 2, 3, 2, 2, 1, 2, 0, 3, 2, 0, 2, 0, 3, 0, 3,
       1, 2, 0, 2, 2, 2, 3, 2, 1, 2, 2, 1, 0, 0, 2, 1, 1, 1, 1, 0, 0, 0,
       3, 2, 3, 1, 3, 1, 2, 3, 1, 2, 1, 3, 3, 1, 3, 3, 1, 2, 1, 1, 1, 0,
       0, 3, 3, 2, 0, 0, 1, 3, 2, 1, 3, 1, 3, 3, 0, 0, 1, 0, 3, 1, 0, 1,
       2, 3, 1, 2, 2, 2, 0, 1, 3, 1, 3, 2, 3, 3, 1, 0, 2, 0, 3, 2, 0, 3,
       3, 1, 0, 3, 1, 3, 0, 2, 2, 0, 2, 3, 1, 1, 3, 3, 0, 1, 3, 2, 2, 2,
       1, 3, 3, 3, 3, 3, 0, 3, 3, 1, 2, 0, 1, 0, 0, 0, 1, 0, 0, 1, 1, 1,
       0, 3, 0, 3, 0, 2, 3, 0, 2, 3, 0, 0, 3, 2, 1, 1, 3, 1, 0, 0, 3, 1,
       1, 0, 0, 3, 1, 3, 0, 3, 0, 1, 2, 2, 0, 2, 3, 2, 2, 1, 2, 1, 0, 2,
       1, 0, 1, 3, 2, 3, 2, 0, 3, 0, 1, 0, 0, 0, 0, 1, 0, 2, 0, 2, 0, 3,
       1, 2, 0, 0, 3, 2, 2, 1, 1, 1, 2, 3, 0, 3, 2, 0, 2, 1, 2, 3, 3, 2,
       1, 3, 1, 1, 2, 1, 2, 1, 3, 3, 3, 2, 1, 1, 1, 1, 2, 1, 3, 0, 0, 3,
       3, 0, 3, 0])
16.1.4.5. 不同 covariance 限制式的影響
剛剛在估計 covariance matrix 時,是沒有設限制式的。
我們現在來試試看,如果用和 KMeans 幾乎等價的限制式 (covariance_type = ‘spherical’) 會怎麼樣:
gm_spherical = GaussianMixture(
    n_components = 4,
    n_init = 10,
    covariance_type = 'spherical'
)

plot_gmm(gm_spherical, X_stretched, covariance_type = "spherical")
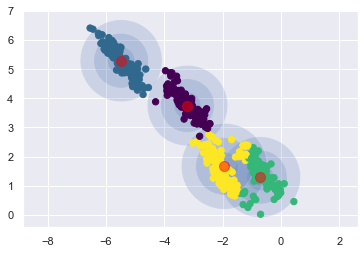
果然跟 KMeans 的結果一樣
那如果換成
covariance_type = 'diag',就換變成用正橢圓來分類,結果預計也不會太好
gm_diag = GaussianMixture(
    n_components = 4,
    n_init = 10,
    covariance_type = 'diag'
)
#gm_diag.fit(X_stretched);
plot_gmm(gm_diag, X_stretched, covariance_type = "diag")
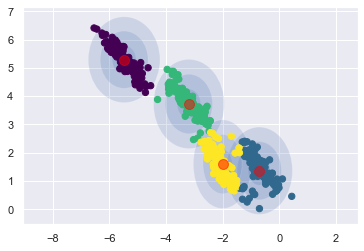
可以看到,結果果然不怎樣,他送出了 4 個直橢圓
接著試試看,如果限制大家都是同一個斜橢圓 (covariance_type = ‘tied’)
gm_tied = GaussianMixture(
    n_components = 4,
    n_init = 10,
    covariance_type = 'tied'
)
plot_gmm(gm_tied, X_stretched, covariance_type = "tied")
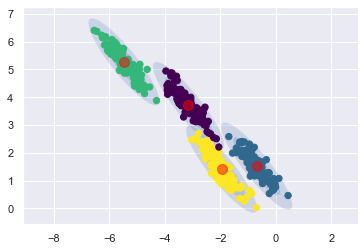
讚拉! 而且這筆模擬資料,看起來的確各個組的 covariance matrix 都差不多
16.1.4.6. 選群數,選 cov 限制式
剛剛都是直接指定 k = 4,現在來用 AIC 和 BIC 選選看:
gms_per_k = [GaussianMixture(n_components=k, n_init=10, random_state=42).fit(X)
             for k in range(1, 11)]

bics = [model.bic(X) for model in gms_per_k]
aics = [model.aic(X) for model in gms_per_k]

arg_min_aic = np.argmin(aics) + 1
arg_min_bic = np.argmin(bics) + 1

print("arg min aic = ", arg_min_aic)
print("arg min bic = ", arg_min_bic)
arg min aic =  4
arg min bic =  4
plt.figure(figsize=(8, 3))
plt.plot(range(1, 11), bics, "bo-", label="BIC")
plt.plot(range(1, 11), aics, "go--", label="AIC")
plt.xlabel("$k$", fontsize=14)
plt.ylabel("Information Criterion", fontsize=14)
plt.axis([1, 9.5, np.min(aics) - 50, np.max(aics) + 50])
plt.annotate('Minimum',
             xy=(arg_min_aic, bics[2]),
             xytext=(0.35, 0.6),
             textcoords='figure fraction',
             fontsize=14,
             arrowprops=dict(facecolor='black', shrink=0.1)
            )
plt.legend()
# save_fig("aic_bic_vs_k_plot")
# plt.show()
<matplotlib.legend.Legend at 0x1303e6490>
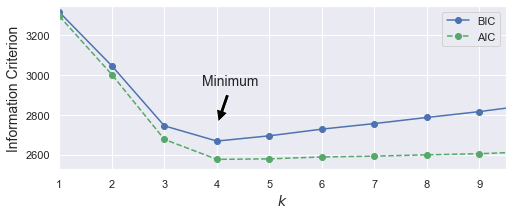
可以得知,選 k = 4 是較好的
最後,我們可以同時把 k 和 covariance_type 都當作 hyper-parameter,然後用 BIC 找出最好的組合:
min_bic = np.infty

for k in range(1, 11):
    for covariance_type in ("full", "tied", "spherical", "diag"):
        bic = GaussianMixture(n_components=k, n_init=10,
                              covariance_type=covariance_type,
                              random_state=42).fit(X).bic(X)
        if bic < min_bic:
            min_bic = bic
            best_k = k
            best_covariance_type = covariance_type
print("best k is: ", best_k)
print("best_covariance_type: ", best_covariance_type)
best k is:  4
best_covariance_type:  tied
結果還不錯,看來大家共用同樣的 covariance matrix,就可以估的很好了 (分群分的 ok ,而且參數比 full 更精簡)
16.1.4.7. 產生資料 與 density estimation
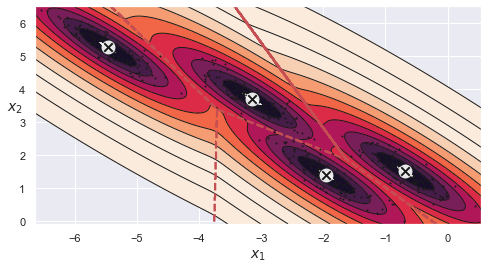
當我們 fit 完 GMM 後,等於得到了一個 pdf.
有這個 pdf,我要生成新資料,或是去算 density 就都很方便了:
# final model
gmm_tied = GaussianMixture(
    n_components = 4,
    n_init = 10,
    covariance_type = 'tied'
)
gmm_tied.fit(X_stretched);

# 隨機生成 5 筆 data
X_new, y_new = gmm_tied.sample(5)
print("生成5筆資料")
print(X_new)
print("此五筆資料來自的 cluster")
print(y_new)
print("此五筆資料的 density")
print(np.exp(gmm_tied.score_samples(X_new)))
生成5筆資料
[[-0.36581533  0.85440405]
 [-5.37152264  5.12592459]
 [-5.33699891  5.03877372]
 [-1.48330776  1.04367111]
 [-2.22834881  2.62981916]]
此五筆資料來自的 cluster
[0 1 1 2 3]
此五筆資料的 density
[0.12417672 0.3755171  0.34741156 0.17303794 0.03868295]
這邊要特別注意的是,因為數值運算的關係,他吐給你的 density,是在 log scale 上的,所以要取 exp,才會得到真的 pdf
我們來驗證一下,此 pdf 的 曲線下的面積會是 1
resolution = 100
grid = np.arange(-10, 10, 1 / resolution)
xx, yy = np.meshgrid(grid, grid)
X_full = np.vstack([xx.ravel(), yy.ravel()]).T

pdf = np.exp(gmm_tied.score_samples(X_full))
pdf_probas = pdf * (1 / resolution) ** 2
pdf_probas.sum()
1.0000000000000424
來畫一下 contour
from matplotlib.colors import LogNorm

def plot_data(X):
    plt.plot(X[:, 0], X[:, 1], 'k.', markersize=2)

def plot_centroids(centroids, weights=None, circle_color='w', cross_color='k'):
    if weights is not None:
        centroids = centroids[weights > weights.max() / 10]
    plt.scatter(centroids[:, 0], centroids[:, 1],
                marker='o', s=35, linewidths=8,
                color=circle_color, zorder=10, alpha=0.9)
    plt.scatter(centroids[:, 0], centroids[:, 1],
                marker='x', s=2, linewidths=12,
                color=cross_color, zorder=11, alpha=1)

def plot_decision_boundaries(clusterer, X, resolution=1000, show_centroids=True,
                             show_xlabels=True, show_ylabels=True):
    mins = X.min(axis=0) - 0.1
    maxs = X.max(axis=0) + 0.1
    xx, yy = np.meshgrid(np.linspace(mins[0], maxs[0], resolution),
                         np.linspace(mins[1], maxs[1], resolution))
    Z = clusterer.predict(np.c_[xx.ravel(), yy.ravel()])
    Z = Z.reshape(xx.shape)

    plt.contourf(Z, extent=(mins[0], maxs[0], mins[1], maxs[1]),
                cmap="Pastel2")
    plt.contour(Z, extent=(mins[0], maxs[0], mins[1], maxs[1]),
                linewidths=1, colors='k')
    plot_data(X)
    if show_centroids:
        plot_centroids(clusterer.cluster_centers_)

    if show_xlabels:
        plt.xlabel("$x_1$", fontsize=14)
    else:
        plt.tick_params(labelbottom=False)
    if show_ylabels:
        plt.ylabel("$x_2$", fontsize=14, rotation=0)
    else:
        plt.tick_params(labelleft=False)


def plot_gaussian_mixture(clusterer, X, resolution=1000, show_ylabels=True):
    mins = X.min(axis=0) - 0.1
    maxs = X.max(axis=0) + 0.1
    xx, yy = np.meshgrid(np.linspace(mins[0], maxs[0], resolution),
                         np.linspace(mins[1], maxs[1], resolution))
    Z = -clusterer.score_samples(np.c_[xx.ravel(), yy.ravel()])
    Z = Z.reshape(xx.shape)

    plt.contourf(xx, yy, Z,
                 norm=LogNorm(vmin=1.0, vmax=30.0),
                 levels=np.logspace(0, 2, 12))
    plt.contour(xx, yy, Z,
                norm=LogNorm(vmin=1.0, vmax=30.0),
                levels=np.logspace(0, 2, 12),
                linewidths=1, colors='k')

    Z = clusterer.predict(np.c_[xx.ravel(), yy.ravel()])
    Z = Z.reshape(xx.shape)
    plt.contour(xx, yy, Z,
                linewidths=2, colors='r', linestyles='dashed')

    plt.plot(X[:, 0], X[:, 1], 'k.', markersize=2)
    plot_centroids(clusterer.means_, clusterer.weights_)

    plt.xlabel("$x_1$", fontsize=14)
    if show_ylabels:
        plt.ylabel("$x_2$", fontsize=14, rotation=0)
    else:
        plt.tick_params(labelleft=False)
plt.figure(figsize=(8, 4))
plot_gaussian_mixture(gmm_tied, X_stretched)
16.1.4.8. anomaly detection
因為有 pdf,就可以算尾機率。
所以,我們可以定義,4% 左右的產品是有缺陷的,那我就想抓出 4% 左右的 outlier.
那作法就是:
算出目前資料的所有資料點所對應的 density.
將 density 由小排到大,算出 density 的 PR4 當 threshold(意義是,只有 4% 的資料, density 會比他小。那就等於排除 4% 的資料)
所有資料中, density 小於此 threshold 的,都認為是 outlier
densities = gmm_tied.score_samples(X_stretched)
density_threshold = np.percentile(densities, 4)
anomalies = X_stretched[densities < density_threshold]
anomalies
array([[-4.63330948,  5.00361975],
       [-2.54838565,  3.64269177],
       [-0.91910995,  1.15856978],
       [-0.86486896,  0.52612946],
       [-4.89433471,  5.18742875],
       [-4.29724243,  3.8822148 ],
       [-3.57676231,  4.75833171],
       [-1.55916518,  1.98841812],
       [-0.94562645,  0.64439676],
       [-0.69821632,  0.02550763],
       [-0.33938455,  1.75038413],
       [ 0.11392436,  1.07418878],
       [-3.73846534,  4.87602497],
       [ 0.4434933 ,  0.45946803],
       [-0.89865011,  0.54233655],
       [-2.05111636,  2.20700669]])
16.3. 推薦的 workflow
16.4. Real world examples
16.4.1. [影像分群] Olivetti
from sklearn.datasets import fetch_olivetti_faces

olivetti = fetch_olivetti_faces()

print(olivetti.target)
print(olivetti.data.shape)
[ 0  0  0  0  0  0  0  0  0  0  1  1  1  1  1  1  1  1  1  1  2  2  2  2
  2  2  2  2  2  2  3  3  3  3  3  3  3  3  3  3  4  4  4  4  4  4  4  4
  4  4  5  5  5  5  5  5  5  5  5  5  6  6  6  6  6  6  6  6  6  6  7  7
  7  7  7  7  7  7  7  7  8  8  8  8  8  8  8  8  8  8  9  9  9  9  9  9
  9  9  9  9 10 10 10 10 10 10 10 10 10 10 11 11 11 11 11 11 11 11 11 11
 12 12 12 12 12 12 12 12 12 12 13 13 13 13 13 13 13 13 13 13 14 14 14 14
 14 14 14 14 14 14 15 15 15 15 15 15 15 15 15 15 16 16 16 16 16 16 16 16
 16 16 17 17 17 17 17 17 17 17 17 17 18 18 18 18 18 18 18 18 18 18 19 19
 19 19 19 19 19 19 19 19 20 20 20 20 20 20 20 20 20 20 21 21 21 21 21 21
 21 21 21 21 22 22 22 22 22 22 22 22 22 22 23 23 23 23 23 23 23 23 23 23
 24 24 24 24 24 24 24 24 24 24 25 25 25 25 25 25 25 25 25 25 26 26 26 26
 26 26 26 26 26 26 27 27 27 27 27 27 27 27 27 27 28 28 28 28 28 28 28 28
 28 28 29 29 29 29 29 29 29 29 29 29 30 30 30 30 30 30 30 30 30 30 31 31
 31 31 31 31 31 31 31 31 32 32 32 32 32 32 32 32 32 32 33 33 33 33 33 33
 33 33 33 33 34 34 34 34 34 34 34 34 34 34 35 35 35 35 35 35 35 35 35 35
 36 36 36 36 36 36 36 36 36 36 37 37 37 37 37 37 37 37 37 37 38 38 38 38
 38 38 38 38 38 38 39 39 39 39 39 39 39 39 39 39]
(400, 4096)
Olivetti 臉譜資料,有 40 個人,每個人都拍 10 張照片,共有 400 張 64x64 的灰階人臉照片。
每張照片都被 flatten 為 4096 維的 1D 向量,
每張照片,都已經被 normalize 到 0~1 之間
這組資料常被用來作為訓練看照片判斷是誰的人臉.
這邊我們要練習分群,看用 GMM 分完群後,是不是每一群裡的人臉長的都差不多
# 先用分層隨機抽樣,將資料分成 train, valid, 和 test

from sklearn.model_selection import StratifiedShuffleSplit

strat_split = StratifiedShuffleSplit(n_splits=1, test_size=40, random_state=42)
train_valid_idx, test_idx = next(strat_split.split(olivetti.data, olivetti.target))
X_train_valid = olivetti.data[train_valid_idx]
y_train_valid = olivetti.target[train_valid_idx]
X_test = olivetti.data[test_idx]
y_test = olivetti.target[test_idx]

strat_split = StratifiedShuffleSplit(n_splits=1, test_size=80, random_state=43)
train_idx, valid_idx = next(strat_split.split(X_train_valid, y_train_valid))
X_train = X_train_valid[train_idx]
y_train = y_train_valid[train_idx]
X_valid = X_train_valid[valid_idx]
y_valid = y_train_valid[valid_idx]
print(X_train.shape, y_train.shape)
print(X_valid.shape, y_valid.shape)
print(X_test.shape, y_test.shape)
(280, 4096) (280,)
(80, 4096) (80,)
(40, 4096) (40,)
先做 PCA,把維度從 4096 維降下來 (這一步,就和 auto-encoder要取 feature 一樣)
from sklearn.decomposition import PCA

pca = PCA(0.99)
X_train_pca = pca.fit_transform(X_train)
X_valid_pca = pca.transform(X_valid)
X_test_pca = pca.transform(X_test)

pca.n_components_
199
可以看到,4096維被降到199維.
接下來,做 GMM
gm2 = GaussianMixture(n_components=40, random_state=42)
y_pred = gm2.fit_predict(X_train_pca)
gm2.bic(X_train_pca)
3897195.689701972
from sklearn.mixture import GaussianMixture

# 選 best k, covariance_type.
bic_list = []
aic_list = []
converage_list = []


min_bic = np.infty

for k in range(5, 150, 5):
    for covariance_type in ("full", "tied", "spherical", "diag"):

        gmm = GaussianMixture(n_components=k, n_init=10,
                              covariance_type=covariance_type,
                              #reg_covar = 1e-5,
                              random_state=42).fit(X_train_pca[:,:2])
        bic_list.append(gmm.bic(X_train_pca[:,:2]))
        aic_list.append(gmm.aic(X_train_pca[:,:2]))
        converage_list.append(gmm.converged_)

    print(f"k = {k} completed")
k = 5 completed
k = 10 completed
---------------------------------------------------------------------------
ValueError                                Traceback (most recent call last)
Input In [256], in <module>
     11 for k in range(5, 150, 5):
     12     for covariance_type in ("full", "tied", "spherical", "diag"):
---> 14         gmm = GaussianMixture(n_components=k, n_init=10,
     15                               covariance_type=covariance_type,
     16                               #reg_covar = 1e-5,
     17                               random_state=42).fit(X_train_pca[:,:2])
     18         bic_list.append(gmm.bic(X_train_pca[:,:2]))
     19         aic_list.append(gmm.aic(X_train_pca[:,:2]))

File /Volumes/GoogleDrive/我的雲端硬碟/0. codepool_python/python_ds/python_ds_env/lib/python3.8/site-packages/sklearn/mixture/_base.py:198, in BaseMixture.fit(self, X, y)
    172 def fit(self, X, y=None):
    173     """Estimate model parameters with the EM algorithm.
    174
    175     The method fits the model ``n_init`` times and sets the parameters with
   (...)
    196         The fitted mixture.
    197     """
--> 198     self.fit_predict(X, y)
    199     return self

File /Volumes/GoogleDrive/我的雲端硬碟/0. codepool_python/python_ds/python_ds_env/lib/python3.8/site-packages/sklearn/mixture/_base.py:251, in BaseMixture.fit_predict(self, X, y)
    248 self._print_verbose_msg_init_beg(init)
    250 if do_init:
--> 251     self._initialize_parameters(X, random_state)
    253 lower_bound = -np.inf if do_init else self.lower_bound_
    255 for n_iter in range(1, self.max_iter + 1):

File /Volumes/GoogleDrive/我的雲端硬碟/0. codepool_python/python_ds/python_ds_env/lib/python3.8/site-packages/sklearn/mixture/_base.py:158, in BaseMixture._initialize_parameters(self, X, random_state)
    153 else:
    154     raise ValueError(
    155         "Unimplemented initialization method '%s'" % self.init_params
    156     )
--> 158 self._initialize(X, resp)

File /Volumes/GoogleDrive/我的雲端硬碟/0. codepool_python/python_ds/python_ds_env/lib/python3.8/site-packages/sklearn/mixture/_gaussian_mixture.py:716, in GaussianMixture._initialize(self, X, resp)
    714 if self.precisions_init is None:
    715     self.covariances_ = covariances
--> 716     self.precisions_cholesky_ = _compute_precision_cholesky(
    717         covariances, self.covariance_type
    718     )
    719 elif self.covariance_type == "full":
    720     self.precisions_cholesky_ = np.array(
    721         [
    722             linalg.cholesky(prec_init, lower=True)
    723             for prec_init in self.precisions_init
    724         ]
    725     )

File /Volumes/GoogleDrive/我的雲端硬碟/0. codepool_python/python_ds/python_ds_env/lib/python3.8/site-packages/sklearn/mixture/_gaussian_mixture.py:347, in _compute_precision_cholesky(covariances, covariance_type)
    345 else:
    346     if np.any(np.less_equal(covariances, 0.0)):
--> 347         raise ValueError(estimate_precision_error_message)
    348     precisions_chol = 1.0 / np.sqrt(covariances)
    349 return precisions_chol

ValueError: Fitting the mixture model failed because some components have ill-defined empirical covariance (for instance caused by singleton or collapsed samples). Try to decrease the number of components, or increase reg_covar.
len(bic_list)
116
bic_list = np.array(bic_list).reshape(29, 4)
aic_list = np.array(aic_list).reshape(29, 4)
np.argmin(bic_list[:,0])
0
bic_list[7,0]
4020766.2213028464
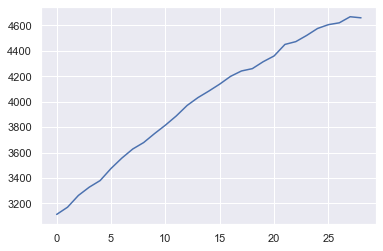
plt.plot(bic_list[:,3])
[<matplotlib.lines.Line2D at 0x13972b730>]
np.argmin(bic_list, axis = 1)
array([[ 0, 28, 28, 0]])
len(bic_list)
27
from sklearn.mixture import GaussianMixture

# 選 best k, covariance_type.
min_bic = np.infty

for k in range(5, 150, 5):
    for covariance_type in ("full", "tied", "spherical", "diag"):
        bic = GaussianMixture(n_components=k, n_init=10,
                              covariance_type=covariance_type,
                              random_state=42).fit(X).bic(X)
        if bic < min_bic:
            min_bic = bic
            best_k = k
            best_covariance_type = covariance_type

    print(f"k = {k} completed")
k = 5 completed
k = 10 completed
k = 15 completed
k = 20 completed
k = 25 completed
k = 30 completed
k = 35 completed
k = 40 completed
k = 45 completed
k = 50 completed
k = 55 completed
k = 60 completed
k = 65 completed
k = 70 completed
k = 75 completed
k = 80 completed
k = 85 completed
k = 90 completed
k = 95 completed
k = 100 completed
k = 105 completed
k = 110 completed
k = 115 completed
k = 120 completed
k = 125 completed
k = 130 completed
k = 135 completed
k = 140 completed
k = 145 completed
best_k
5
best_covariance_type
'tied'
gm = GaussianMixture(n_components=best_k, covariance_type = best_covariance_type, random_state=42)
y_pred = gm.fit_predict(X_train_pca)
16.4.2. [Density Estimation] moon data
GMM 不只可以拿來做 Clustering,還可以拿來估計出一組多變量資料的 jpdf
以 moon 資料集來說:
from sklearn.datasets import make_moons
Xmoon, ymoon = make_moons(200, noise=.05, random_state=0)
plt.scatter(Xmoon[:, 0], Xmoon[:, 1]);
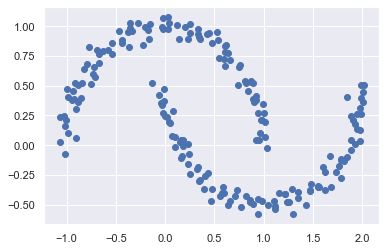
這組資料,是二維的,而且,一看就知道,這組資料不會是二元常態分配.
那如果你還用分群的角度看他,你可能會想 fit 一個 k = 2 的 GMM,那他只會跟你說悲劇,因為這很明顯不能用兩個橢圓區分開來:
gmm2 = GaussianMixture(n_components=2, covariance_type='full', random_state=0)
plot_gmm(gmm2, Xmoon)
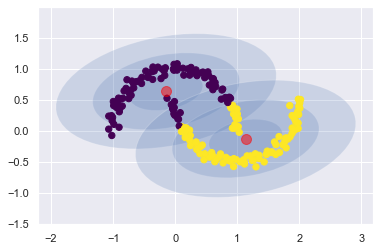
從分群的角度看回來的話,他其實是告訴我們,這個 moon data 背後的 jpdf,不會是 2 個 normal 的 mixture.
那 …,有沒有可能是多個 normal 的 mixture 呢?
就好比任意一個訊號,你可以用好幾個不同頻率的 sin, cos 來組出這個訊號一樣
任意一個一維資料的 pdf,我可以用多個不同的 normal 的線性組合把他組出來.
任意一個多維資料的 jpdf,我可以用多個不同的 多變量 normal 的線性組合把他組出來.
所以,我們就直接以量取勝,看 k 要取到多少時, AIC 就好棒棒了:
n_components = range(1,20)
models = [GaussianMixture(n, covariance_type='full', random_state=0)
          for n in n_components]
bics = [model.fit(data).bic(data) for model in models]
arg_min_bic = np.argmin(bics)+1

print("arg_min_bic: ", arg_min_bic)
plt.plot(n_components, bics);
arg_min_bic: 10
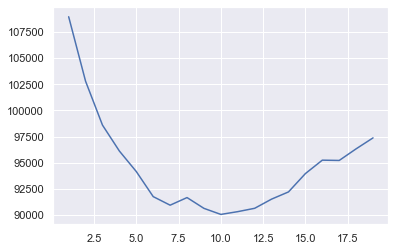
可以得知,用 10 個不同的二元常態,可以去近似的很好
那我們就來 fit 看看
gmm10 = GaussianMixture(n_components=arg_min_bic, covariance_type='full', random_state=0)
plot_gmm(gmm10, Xmoon, label=False)
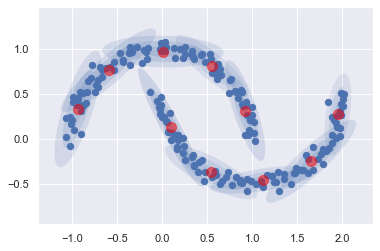
分成 10 群,然後這堆橢圓把他 fit 的很清楚
現在用這個 model 來生成資料,看看生出來的點像不像 moon
moon_gen, moon_cluster = gmm10.sample(200)
plt.scatter(x = moon_gen[:,0], y = moon_gen[:,1]);
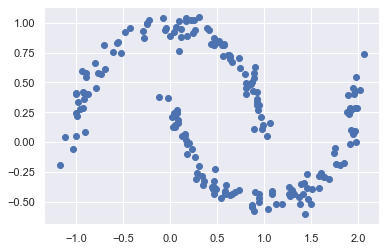
nice~ 生成的不錯
16.4.3. [影像生成] Digits Number
假設我們已經有一組資料了(Digits Number資料集)
from sklearn.datasets import load_digits
digits = load_digits()
digits.data.shape
(1797, 64)
這筆資料有 1797 筆,每筆是 64 維的 feature.
大概長成這樣:
def plot_digits(data):
    fig, ax = plt.subplots(10, 10, figsize=(8, 8),
                           subplot_kw=dict(xticks=[], yticks=[]))
    fig.subplots_adjust(hspace=0.05, wspace=0.05)
    for i, axi in enumerate(ax.flat):
        im = axi.imshow(data[i].reshape(8, 8), cmap='binary')
        im.set_clim(0, 16)
plot_digits(digits.data)
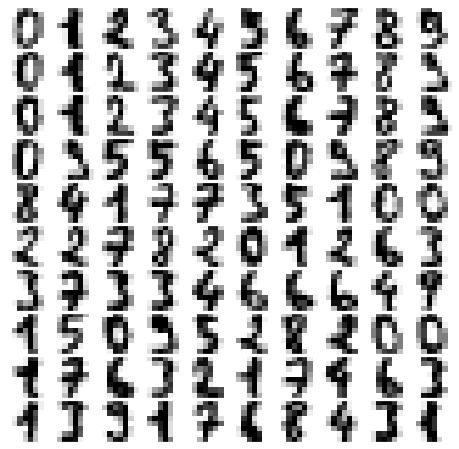
我們可以將 1797 筆的資料,用 GMM 做分群。等我們 fitting 完後,就可以自動生成資料.
但像這題 64 個 feature,對 GMM 來說,也有點吃不消了
因為如果你用
covariance_type = "full"來估的話,參數個數就有 1/2 x 10 x (64+1) x (64+2) -1 = 21449。但資料才 1797 筆所以,我們打算
先把圖片用 PCA 壓縮 (保留 99% 的變異量)
壓縮完,再 fitting GMM
用 GMM 生成新資料
用 PCA 轉換回原尺度.
# 降維
from sklearn.decomposition import PCA
pca = PCA(0.99, whiten=True)
data = pca.fit_transform(digits.data)
data.shape
(1797, 41)
接下來,就去 fit GMM,並用 BIC 選一下需要多少個 component
n_components = np.arange(30, 100, 10)
models = [GaussianMixture(n, covariance_type='full', random_state=0)
          for n in n_components]
bics = [model.fit(data).bic(data) for model in models]

arg_min_bic = n_components[np.argmin(bics)]
print("arg_min_bic: ", arg_min_bic)
plt.plot(n_components, bics);
arg_min_bic: 70
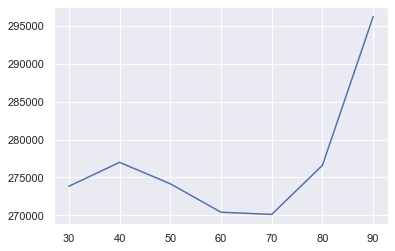
可以發現,70 個 components 可以 minimize BIC,那就來 fit 這個 model
gmm70 = GaussianMixture(70, covariance_type='full', random_state=0)
gmm70.fit(data)
print(gmm70.converged_)
True
接下來,先生成 100 張 data,再轉回圖片的尺度
data_new, data_target = gmm70.sample(100)
print(data_new.shape)

digits_new = pca.inverse_transform(data_new)
print(digits_new.shape)

plot_digits(digits_new)
(100, 41)
(100, 64)
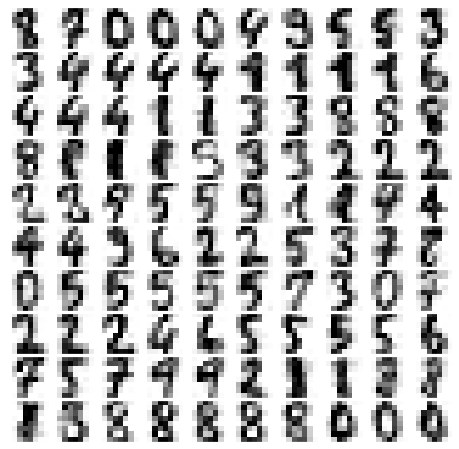
看起來還行啊~~
k = 10
p = 21
(1/2)*k*(p+1)*(p+2) -1
2529.0
16.5. 要再看的資源
讀完 Olivetti 資料 (p269)
看其他 anomaly detection 的資料.
Isolation Forest: https://tomohiroliu22.medium.com/機器學習-學習筆記系列-95-孤立森林-isolation-forest-7efa96213eec
Minimum Covariance Determinant:
範例 jupyter notebook:

