Histograms and Density
Contents
9. Histograms and Density
%matplotlib inline
import numpy as np
import matplotlib.pyplot as plt
plt.style.use('seaborn-white')
9.1. 一維的直方圖
一個簡單的直方圖,就用
plt.hist()就可以完成:
data = np.random.randn(1000)
plt.hist(data);
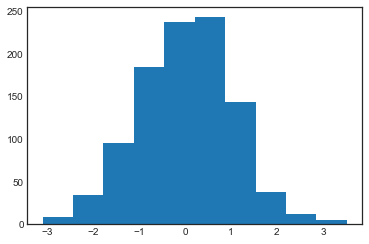
我們還有很多客製化的參數可以下:
plt.hist(data,
         bins=30,
         color='steelblue',
         edgecolor='none',
         histtype='stepfilled',
         alpha=0.5);
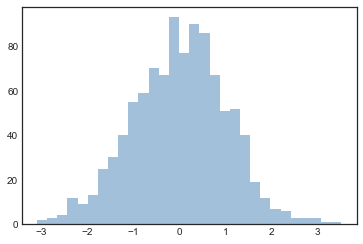
如果想得到分類後的數據就好,那可以這樣做
counts, bin_edges = np.histogram(data, bins=5)
print(bin_edges) # 每個bin的起點終點
print(counts) # 每個 bin 對應到的次數
[-3.09793211 -1.77395464 -0.44997717  0.87400031  2.19797778  3.52195525]
[ 43 279 480 181  17]
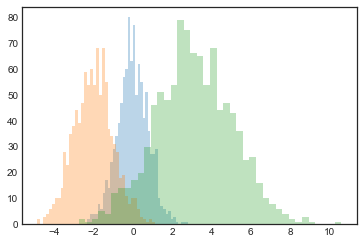
如果要同時畫多個 histogram,那就多做幾次
plt.hist()就好:
x1 = np.random.normal(0, 0.8, 1000)
x2 = np.random.normal(-2, 1, 1000)
x3 = np.random.normal(3, 2, 1000)

kwargs = dict(histtype='stepfilled', alpha=0.3, bins=40)

plt.hist(x1, **kwargs)
plt.hist(x2, **kwargs)
plt.hist(x3, **kwargs);
9.2. 二維的直方圖
# 生出二維常態的資料
mean = [0, 0]
cov = [[1, 1], [1, 2]]
x, y = np.random.multivariate_normal(mean, cov, 10000).T
9.2.1. plt.hist2d: 二維直方圖
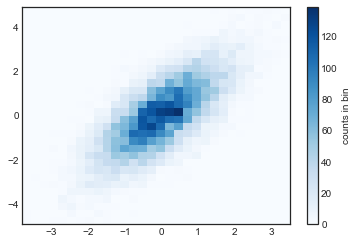
剛剛一維的 histogram,是用
plt.hist()來畫,現在二維的 histogram,是用plt.hist2d()來畫.
plt.hist2d(x, y, bins=30, cmap='Blues')
cb = plt.colorbar()
cb.set_label('counts in bin')
就像剛剛可以用
np.histogram()來得到組別和各組的count的訊息,現在可以用np.histogram2d()來得到各組的組別(就是x和y的range)以及組別的count。作法如下:
counts, xedges, yedges = np.histogram2d(x, y, bins=30)
print(counts)
print(xedges)
print(yedges)
[[  1.   1.   0.   0.   0.   0.   0.   0.   0.   0.   0.   0.   0.   0.
    0.   0.   0.   0.   0.   0.   0.   0.   0.   0.   0.   0.   0.   0.
    0.   0.]
 [  0.   0.   0.   0.   0.   0.   1.   0.   0.   0.   0.   0.   0.   0.
    0.   0.   0.   0.   0.   0.   0.   0.   0.   0.   0.   0.   0.   0.
    0.   0.]
 [  0.   0.   0.   0.   0.   1.   0.   0.   0.   0.   0.   0.   0.   0.
    0.   0.   0.   0.   0.   0.   0.   0.   0.   0.   0.   0.   0.   0.
    0.   0.]
 [  1.   0.   0.   0.   0.   2.   0.   1.   1.   0.   2.   0.   1.   0.
    0.   0.   0.   0.   0.   0.   0.   0.   0.   0.   0.   0.   0.   0.
    0.   0.]
 [  1.   0.   4.   7.   1.   1.   3.   3.   1.   0.   0.   0.   1.   0.
    0.   0.   0.   0.   0.   0.   0.   0.   0.   0.   0.   0.   0.   0.
    0.   0.]
 [  0.   3.   6.   3.   7.   4.   3.   5.   3.   4.   5.   2.   1.   0.
    1.   0.   0.   0.   0.   0.   0.   0.   0.   0.   0.   0.   0.   0.
    0.   0.]
 [  1.   0.   2.   1.   6.  10.   8.   9.   8.  10.  10.   9.   3.   2.
    1.   0.   1.   0.   0.   0.   0.   0.   0.   0.   0.   0.   0.   0.
    0.   0.]
 [  2.   0.   3.   3.   7.  17.   9.  18.  14.  24.  14.  13.  10.   8.
    0.   1.   2.   0.   1.   0.   0.   0.   0.   0.   0.   0.   0.   0.
    0.   0.]
 [  0.   3.   1.   3.   9.  15.  15.  24.  25.  33.  21.  28.  19.  16.
   10.   6.   0.   1.   0.   0.   0.   0.   0.   0.   0.   0.   0.   0.
    0.   0.]
 [  1.   1.   1.   5.   6.  14.  20.  22.  35.  34.  42.  42.  43.  28.
   12.   7.   2.   4.   2.   0.   0.   0.   0.   0.   0.   0.   0.   0.
    0.   0.]
 [  0.   0.   1.   0.   3.  10.  21.  31.  36.  53.  59.  58.  50.  57.
   34.  32.  16.   5.   4.   2.   1.   1.   0.   0.   0.   0.   0.   0.
    0.   0.]
 [  0.   0.   0.   0.   2.  11.   9.  22.  43.  49.  75.  60.  70.  63.
   59.  33.  22.  22.  12.   1.   1.   3.   0.   1.   0.   0.   0.   0.
    0.   0.]
 [  0.   1.   0.   2.   1.   5.  13.  23.  28.  57.  69.  91. 108.  83.
   77.  53.  48.  32.  21.  10.   4.   2.   0.   0.   0.   0.   0.   0.
    0.   0.]
 [  0.   0.   0.   0.   1.   7.   9.  17.  40.  44.  68.  97. 105. 118.
  119. 111.  70.  38.  22.  12.   6.   4.   2.   1.   0.   0.   0.   0.
    0.   0.]
 [  0.   0.   0.   0.   0.   1.   4.  13.  26.  43.  50.  78. 108. 127.
  107. 119. 115.  65.  60.  39.  14.   7.   4.   0.   0.   0.   0.   0.
    0.   0.]
 [  0.   0.   0.   0.   0.   1.   0.   2.  18.  27.  56.  66.  91. 107.
  117. 130. 113.  89.  76.  36.  32.  18.   6.   2.   0.   0.   0.   0.
    0.   0.]
 [  0.   0.   0.   0.   0.   1.   1.   1.   9.  15.  31.  53.  76.  63.
  106. 133. 119.  82.  90.  68.  40.  26.  10.   5.   2.   0.   0.   0.
    0.   0.]
 [  0.   0.   0.   0.   0.   0.   1.   2.   7.   5.  17.  29.  32.  77.
  103. 139. 107. 106. 101.  56.  51.  28.  14.   7.   4.   0.   0.   0.
    0.   0.]
 [  0.   0.   0.   0.   0.   0.   2.   1.   0.   5.   9.  12.  28.  35.
   73.  71.  95.  88.  80.  72.  69.  41.  22.  13.   5.   4.   0.   1.
    0.   0.]
 [  0.   0.   0.   0.   0.   0.   0.   0.   0.   8.   4.   7.  18.  27.
   37.  57.  69.  73.  73.  63.  52.  43.  40.  11.   5.   5.   1.   0.
    0.   0.]
 [  0.   0.   0.   0.   0.   0.   0.   0.   0.   0.   1.   8.   9.   8.
   22.  37.  41.  57.  54.  61.  45.  37.  27.  24.   9.   6.   1.   0.
    0.   0.]
 [  0.   0.   0.   0.   0.   0.   0.   0.   0.   0.   0.   2.   5.   8.
   13.  24.  22.  40.  51.  37.  39.  30.  25.  24.  15.  10.   1.   0.
    0.   1.]
 [  0.   0.   0.   0.   0.   0.   0.   0.   0.   0.   0.   0.   2.   3.
   10.  14.  13.  15.  30.  23.  39.  22.  21.  11.  11.   6.   6.   1.
    0.   0.]
 [  0.   0.   0.   0.   0.   0.   0.   0.   0.   0.   0.   0.   0.   3.
    1.   2.   4.   8.  18.  22.  21.  26.  14.  19.  10.   4.   3.   3.
    2.   1.]
 [  0.   0.   0.   0.   0.   0.   0.   0.   0.   0.   0.   0.   1.   0.
    1.   0.   1.   3.   8.   9.  13.  13.   8.   7.  14.   5.   5.   0.
    3.   0.]
 [  0.   0.   0.   0.   0.   0.   0.   0.   0.   0.   0.   0.   0.   0.
    1.   1.   1.   3.   3.   4.   5.  12.   7.   7.   6.   5.   2.   1.
    0.   1.]
 [  0.   0.   0.   0.   0.   0.   0.   0.   0.   0.   0.   0.   0.   0.
    0.   0.   0.   0.   2.   0.   5.   1.   3.   3.   3.   2.   4.   2.
    2.   1.]
 [  0.   0.   0.   0.   0.   0.   0.   0.   0.   0.   0.   0.   0.   0.
    0.   0.   0.   0.   0.   0.   1.   2.   2.   3.   1.   1.   1.   0.
    1.   2.]
 [  0.   0.   0.   0.   0.   0.   0.   0.   0.   0.   0.   0.   0.   0.
    0.   0.   0.   0.   0.   0.   0.   0.   1.   2.   1.   2.   0.   3.
    0.   1.]
 [  0.   0.   0.   0.   0.   0.   0.   0.   0.   0.   0.   0.   0.   0.
    0.   0.   0.   0.   0.   0.   0.   0.   0.   1.   0.   1.   0.   0.
    2.   0.]]
[-3.80099282 -3.55740187 -3.31381093 -3.07021999 -2.82662904 -2.5830381
 -2.33944716 -2.09585621 -1.85226527 -1.60867433 -1.36508338 -1.12149244
 -0.8779015  -0.63431055 -0.39071961 -0.14712867  0.09646228  0.34005322
  0.58364416  0.82723511  1.07082605  1.31441699  1.55800794  1.80159888
  2.04518982  2.28878077  2.53237171  2.77596265  3.0195536   3.26314454
  3.50673548]
[-4.91027112e+00 -4.58299194e+00 -4.25571276e+00 -3.92843359e+00
 -3.60115441e+00 -3.27387523e+00 -2.94659606e+00 -2.61931688e+00
 -2.29203770e+00 -1.96475853e+00 -1.63747935e+00 -1.31020017e+00
 -9.82920995e-01 -6.55641818e-01 -3.28362641e-01 -1.08346439e-03
  3.26195713e-01  6.53474889e-01  9.80754066e-01  1.30803324e+00
  1.63531242e+00  1.96259160e+00  2.28987077e+00  2.61714995e+00
  2.94442913e+00  3.27170830e+00  3.59898748e+00  3.92626666e+00
  4.25354584e+00  4.58082501e+00  4.90810419e+00]
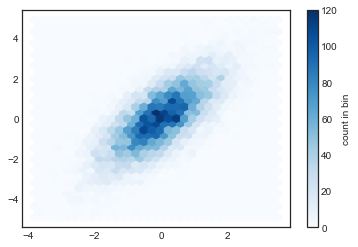
plt.hexbin(x, y, gridsize=30, cmap='Blues')
cb = plt.colorbar(label='count in bin')
9.2.2. Kernel density estimation
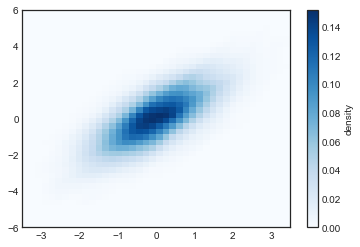
我們也可以去估計二維分配的 density,例如,我假設資料服從二維常態,然後去估計他
我們可以用
scipy.stats這個 module
from scipy.stats import gaussian_kde

# fit an array of size [Ndim, Nsamples]
data = np.vstack([x, y])
kde = gaussian_kde(data)

# evaluate on a regular grid
xgrid = np.linspace(-3.5, 3.5, 40)
ygrid = np.linspace(-6, 6, 40)
Xgrid, Ygrid = np.meshgrid(xgrid, ygrid)
Z = kde.evaluate(np.vstack([Xgrid.ravel(), Ygrid.ravel()]))

# Plot the result as an image
plt.imshow(Z.reshape(Xgrid.shape),
           origin='lower', aspect='auto',
           extent=[-3.5, 3.5, -6, 6],
           cmap='Blues')
cb = plt.colorbar()
cb.set_label("density")
之後在 深入研究: 核密度估計的章節,會介紹 kernel density的估計方法。
後面的 使用seaborn進行視覺化,也會介紹seaborn更簡潔的語法,做到更客製化的繪圖。
