Colorbars
Contents
11. Colorbars
import matplotlib.pyplot as plt
plt.style.use('classic')
%matplotlib inline
import numpy as np
就跟之前示範的一樣,我們可以用
plt.colorbar()來做出 colorbar
x = np.linspace(0, 10, 1000)
I = np.sin(x) * np.cos(x[:, np.newaxis])

plt.imshow(I)
plt.colorbar();
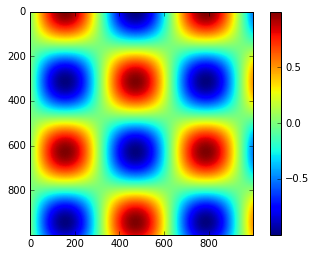
接下來來講些客製化細節吧
11.1. Customizing Colorbars
畫圖的時候,
cmap這個 argument 是 color map (色彩對應表) 的縮寫,他可以決定我的圖的顏色例如,我改成灰階 (數字由小到大,對應到顏色由黑到白)
plt.imshow(I, cmap='gray');
plt.colorbar();
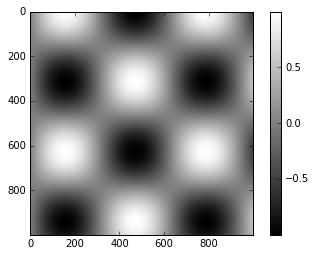
至於
cmap可下的參數有哪些,可按 Tab 鍵看到跳出的結果:plt.cm.<TAB>.
11.1.1. color bars 要用的顏色(color map)
大概有三種 colormap 的設定方式
連續一系列的色彩 (e.g. “binary”, “viridis”)
給兩個顏色來組出最小值到最大值的顏色 (e.g. “RdBu”, “PuOr”)
沒有特別順序的色彩組成 (e.g. “rainbow”, “jet”)
我們來寫個函數,可以好好的視覺化不同的 colormap
def view_colormap(cmap):
    """Plot a colormap with its grayscale equivalent"""
    cmap = plt.cm.get_cmap(cmap)
    colors = cmap(np.arange(cmap.N))
    plt.imshow([colors], extent=[0, 10, 0, 1])
11.1.1.2. 給兩個顏色
view_colormap("RdBu")

11.1.2. Color limits and extensions
colorbar本身就是plt.Axes這個 class 的一個 instance.所以,所有的 axes 和 tick 都是可以設定的.
馬上來看個例子:
# 製造一個影像,裡面有 1% 的雜訊
speckles = (np.random.random(I.shape) < 0.01)
I[speckles] = np.random.normal(0, 3, np.count_nonzero(speckles))

plt.figure(figsize=(10, 3.5))
plt.imshow(I, cmap='RdBu')
plt.colorbar()
<matplotlib.colorbar.Colorbar at 0x118e3e4c0>
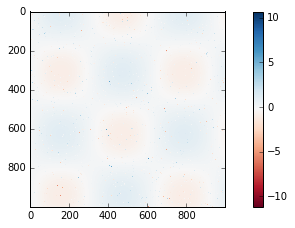
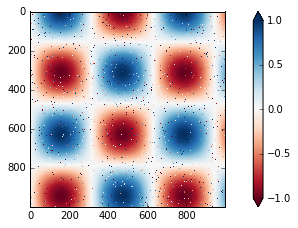
可以看到,color bar 為了把零星的雜訊 (值已經衝到 < -10 or >10,其實就是 outlier) 也包進來,反而原本要顯示的圖 (值介於 -1~1) 看不清楚了
那對於這種狀況,我可以限制我的圖的
clim(color limit的縮寫),來顯示 -1 ~ 1 的點就好:
plt.figure(figsize=(10, 3.5))
plt.imshow(I, cmap='RdBu')
plt.clim(-1,1);
plt.colorbar();
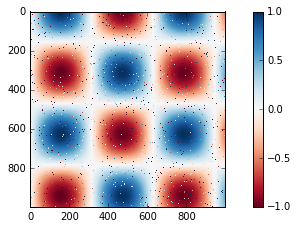
已經相當不錯了,但其實那些雜訊,並不是 -1 或 1,這樣顯示會有點誤導之嫌,所以我們可以用
extend這個 argument,讓 color bar 展現延伸的樣子,就會比較清楚:
plt.figure(figsize=(10, 3.5))
plt.imshow(I, cmap='RdBu')
plt.clim(-1,1);
plt.colorbar(extend='both');
11.1.3. 離散的 color bars
Colormaps are by default continuous, but sometimes you’d like to represent discrete values.
The easiest way to do this is to use the plt.cm.get_cmap() function, and pass the name of a suitable colormap along with the number of desired bins:
plt.imshow(I, cmap=plt.cm.get_cmap('Blues', 6))
plt.colorbar()
plt.clim(-1, 1);
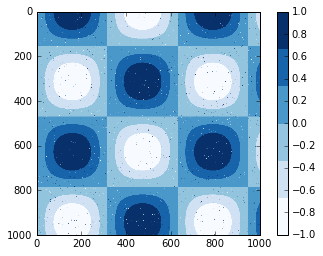
The discrete version of a colormap can be used just like any other colormap.
11.2. Example: Handwritten Digits
我們來看一下手寫資料視覺化的例子.
這些資料在 scikit-learn 中可以找到,有接近 2000 個 8x8 的圖片.
我們下載 0~5 的數字影像,然後看一下長怎樣:
# load images of the digits 0 through 5 and visualize several of them
from sklearn.datasets import load_digits
digits = load_digits(n_class=6)

fig, ax = plt.subplots(8, 8, figsize=(6, 6))
for i, axi in enumerate(ax.flat):
    axi.imshow(digits.images[i], cmap='binary')
    axi.set(xticks=[], yticks=[])
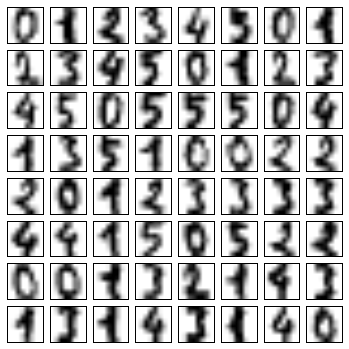
每一張圖片,都是 8x8,共 64 個像素,所以一張圖片可以看成在 64 維空間裡的一個點。每一個維度表示那個對應像素的亮度。
接下來,我們把它降到 2 維,再畫散布圖看看:
# project the digits into 2 dimensions using IsoMap
from sklearn.manifold import Isomap
iso = Isomap(n_components=2)
projection = iso.fit_transform(digits.data)
/Volumes/GoogleDrive/我的雲端硬碟/0. codepool_python/python_ds/python_ds_env/lib/python3.8/site-packages/sklearn/manifold/_isomap.py:324: UserWarning: The number of connected components of the neighbors graph is 2 > 1. Completing the graph to fit Isomap might be slow. Increase the number of neighbors to avoid this issue.
  self._fit_transform(X)
/Volumes/GoogleDrive/我的雲端硬碟/0. codepool_python/python_ds/python_ds_env/lib/python3.8/site-packages/scipy/sparse/_index.py:82: SparseEfficiencyWarning: Changing the sparsity structure of a csr_matrix is expensive. lil_matrix is more efficient.
  self._set_intXint(row, col, x.flat[0])
我們將用離散型 color map,來顯示這些點:
# plot the results
plt.scatter(projection[:, 0],
            projection[:, 1],
            lw=0.1,
            c=digits.target,
            cmap=plt.cm.get_cmap('cubehelix', 6)) # 離散型的 6 個顏色怎選?我選 cubehelix 中的 6 個
plt.colorbar(ticks=range(6), label='digit value')
plt.clim(-0.5, 5.5)
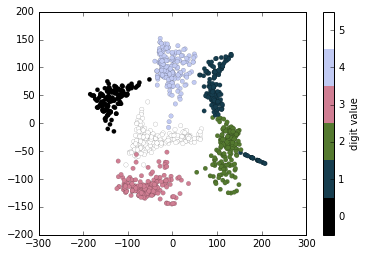
從圖可以看到, 5 和 3 有些微重疊,所以看來這兩個類別分得不太乾淨。但像 0 和 1 就很好分。


